
Last summer, affordability dropped with a sudden increase in interest rates. This means that buyers have less purchasing power and cannot afford as much house as they could in spring 2022.
In spring 2022 I appraised a house that was under contract for $400,000 with $20,000 down and $380,000 to be financed. The monthly payment was about $2400. Fast forward to this spring after rates had doubled. $2400 per month now will service less than $300,000. Add the $20,00 down payment and that buyer would be able to buy a $320,000 house.
2018 in Review
Recently I have seen reports that the single family real estate market is showing signs of cooling off.
You wouldn’t know it if you looked at sales of all property types and all transactions. All property types include detached houses and attached units like a twin-home, townhouse or condo. All transactions include traditional sales and distressed sales like foreclosure and short sale. The chart shows an increase in median price from $246,000 to $265,000, an increase of 7.7%.
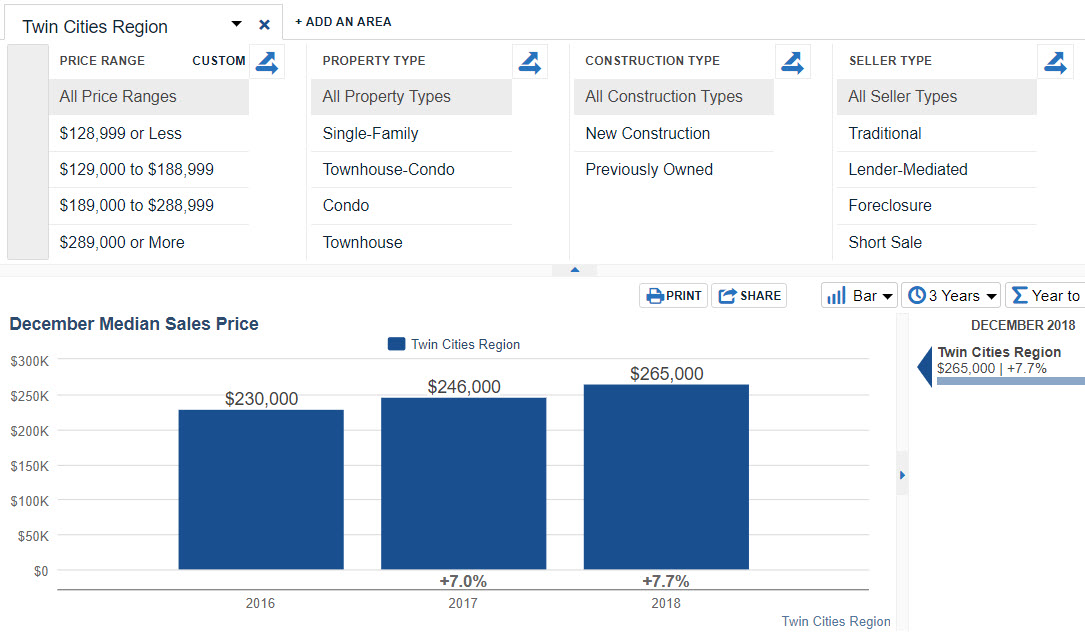
Does this mean that your house increased 7.7% from last year? Probably not.
Lets say you own a single family detached house in Bloomington, and you know it is in the top price quartile, above $259,000. This is how your market looks.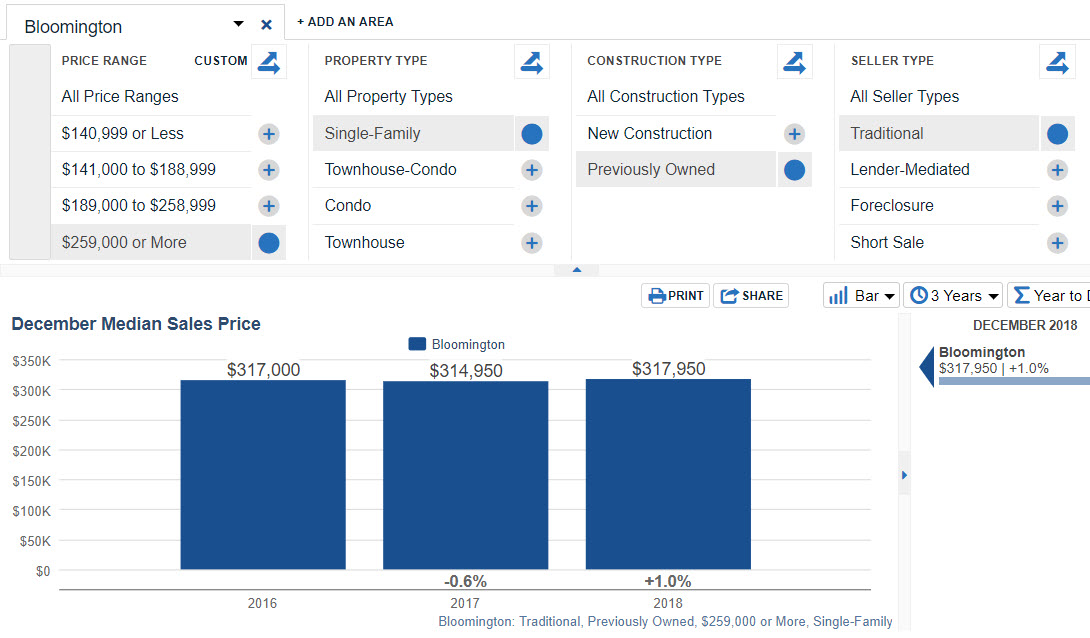
Prices have remained stable over the past 3 years.
Give me a call to talk about your particular situation. Every market is different.
Scott Cullen 612 810 3491
2016 In Review
Have you heard about the HOT metro real estate market? Watch as I take you through the market in about a minute.
If you include all seller types, all construction types, all property types and all price ranges, the median price improved 5.5% over last year.
But lets say you are the owner of a house in the top quartile, over $289,000. Then you would be interested in Traditional sales of Previously Owned, Single-Family, $289,000 or More. Here we see 2016 was up 0.4% over 2015, which was down 1.3% from 2014. If this is your segment of the market, things have not changed.
If you are in the $189,000 to $288,999 range, the market gained 1.5% over 2015 and 2.2% over 2014. The market is healthy.
But not HOT.
Call me to talk about your situation. 612 810 3491.
2015 In Review
Once again we hear reports about the hot real estate market. Watch the video and you will see that “the market” does look great overall. Up 6.3% over last year. But watch as I click through some selections that drill down to what is going on for a segment that may fit your situation. Traditional sale (no short sale or foreclosure), previously owned, single family, top quartile (over $289,000).
Happy New Year 2015
Twin City median prices are up this year!
The focus here is on traditional sale transactions because they represent fair market value, not discounted short sale or bank owned properties.
The December 2013 single family median price was $225,000. December 2014 is up 6.4% to $239,500. This is good news, but it is too general to know your specific situation. As an example, there is very little change in the upper quartile from $390,000 to $390,978.
Condos are up 6.7% from $149,000 to $160,000. Townhouses are up 2.9% from $165,000 to $169,900.
Again, this is just a general comment on the market as a whole. For specific questions, give me a call at 612 810-3491.
Low Appraisals
I was recently asked to reconsider my opinion of value on a “low” appraisal. The house was listed at $239,900 and came under contract at $239,000 with 3% seller paid closing costs, meaning that the seller was receiving $231,830. My opinion was $232,000.
The contract was based on a 5% down mortgage. My client, the lender, ordered the appraisal to evaluate their risk in lending 95% of the purchase price.
I’m not a banker, but it makes sense that they would be very concerned about the value they are lending against. If it were 50% down, the borrower would not be likely to walk away, and if they did, they could absorb the costs of selling the house and still get their money back. But at 5% down the collateral becomes very important.
Lenders want to see proof that the collateral is worth enough to support the loan.
They want to see what the most similar houses are selling for, in case they become a seller. They are thinking about size, distance, time, age, BR count, bath count, age, etc. In practice, guidelines have been established so that when they are processing a loan, appraisals that do not conform to these guidelines get extra scrutiny. They want to make sure the appraiser is not just hitting a number to get a deal done.
As they read the appraisal, they are looking for something called bracketing. This means that there is at least one comparable that is equal or inferior in measurables like GLA (above grade square footage not including basement or porch), above grade BR count and above grade bath count. Secondary features like basement finish, garage stalls, fireplaces etc should also be good matches.
Things that make them nervous are values based on new appliances (try financing appliances for 30 years), landscaping, décor, anything that will depreciate quickly with time or fashion.
When I was asked to reconsider value, I asked the agent to send me at least one example of a house that is smaller that sold for more money. The closest one was over 4 miles away. The distance may not be important to a particular buyer, but it does raise the question of how the appraisal could be low if there was nothing smaller nearby that sold for more.
Spring Market
The Minneapolis St Paul metro real estate market is usually strongest in the spring. This year appears to be no exception with attractive rates and welcome end to snow and cold. People who have been thinking about entering the market are out looking at houses.
The chart below looks back at the most recent 12 month periods. The dramatic increases are mostly due to the absorption of distressed properties, but we are clearly in recovery.

Recovery
Happy New Year
It is time to look back and see how the Minneapolis / St Paul residential real estate market performed in 2013.
What did you read in the press? That the market is strong with double digit gains in median price? Every story I read in the news media said the same thing. Median prices are up. Take a look. The chart below shows a gain of 14.4%!!

But what does it mean to you? It depends on many factors. If you are a bank with foreclosure properties you would like to sell, the market has been very good. The next chart shows a gain of 12.7%.
If you are a rehabber who buys foreclosures, things may be getting tight because your acquisition costs are 12.7% higher, but the Traditional retail market is up by only 5.4%.

If you are a homeowner with equity, you need to know your price range to understand how you are doing. The third chart breaks out the numbers by quartile. The low end, below $140,000, had a gain of 4.8%. The high end, above $300,000, saw a slight decline.

If you are faced with decisions about Minneapolis / St Paul residential real estate, I would be happy help.
Happy New Year.
The Recovery Part III
Last time we saw that the 15% median price increase we hear in the news is really only about 8% when considering the mix of sales. Fewer distressed (discounted) properties in the mix make the median price rise. This time, let’s look at median price, traditional sales only, by price range. Houses above $300,000 have increased less than 1% over last year. They are essentially the same as 2 years ago: $396,050 vs $395,000. Houses in the $140,000 to $200,000 range are up 2% compared to last year, which was even with the year before. Here is my point: if you need your property appraised for reasons like divorce, estate or asset division, please call an experienced appraiser who can sort things out for you.
The Recovery Part II
The prior post showed that the market is in recovery, with news accounts and MLS data agreeing that median price is up about 15%. The question asked last time was “what accounts for the dramatic increase? Is it low rates? Better job market? Buyer confidence? All three?”.
The following chart uses the same data as the previous one and points to an overlooked reason behind the recovery. Maybe the low rates, better job market etc. were the influences that changed the mix of sales, but it seems to me that the increase in median is largely due to fewer distressed properties in the sample. Looking at the change in median price for traditional properties alone, the increase is more like 9%. But how does this relate to you? It all depends on the price range. Stay tuned for more…..
